

America’s Car-Mart Reports Fourth Quarter and Fiscal Year 2025 Results
/EIN News/ -- ROGERS, Ark, June 12, 2025 (GLOBE NEWSWIRE) -- America’s Car-Mart, Inc. (NASDAQ: CRMT) (“we,” “Car-Mart” or the “Company”), today reported financial results for the fourth quarter and full year ended April 30, 2025.
Fourth Quarter Key Highlights (FY’25 Q4 vs. FY’24 Q4, unless otherwise noted)
Full Year Key Highlights (FY’25 vs. FY’24, unless otherwise noted)
|
President and CEO Doug Campbell commentary:
“Fiscal year 2025 marked a pivotal period of transformation for our business as we successfully laid much of the groundwork for growth. Key accomplishments include expanded capabilities of our loan origination system (LOS), strengthening of our leadership team, and the expansion of gross margins. Our work related to our capital structure is notable and will continue into the new fiscal year. I’m incredibly proud of our team’s dedication and execution.”
“Despite a dynamic industry environment, we remain agile and focused on positioning the Company for profitable, long-term success. We are excited to turn our attention to expanding our differentiated model and help more consumers stay on the road.”
| Fourth Quarter Fiscal Year 2025 Key Operating Metrics |
Dollars in thousands, except per share data. Dollar and percentage changes may not recalculate due to rounding. Charts may not be to scale.
| Fiscal Year 2025 Key Operating Metrics |
Dollars in thousands, except per share data. Dollar and percentage changes may not recalculate due to rounding. Charts may not be to scale.

| Fourth Quarter Business Review |
Note: Discussions in each section provide information for the fourth quarter of fiscal year 2025, compared to the fourth quarter of fiscal year 2024, unless otherwise noted.
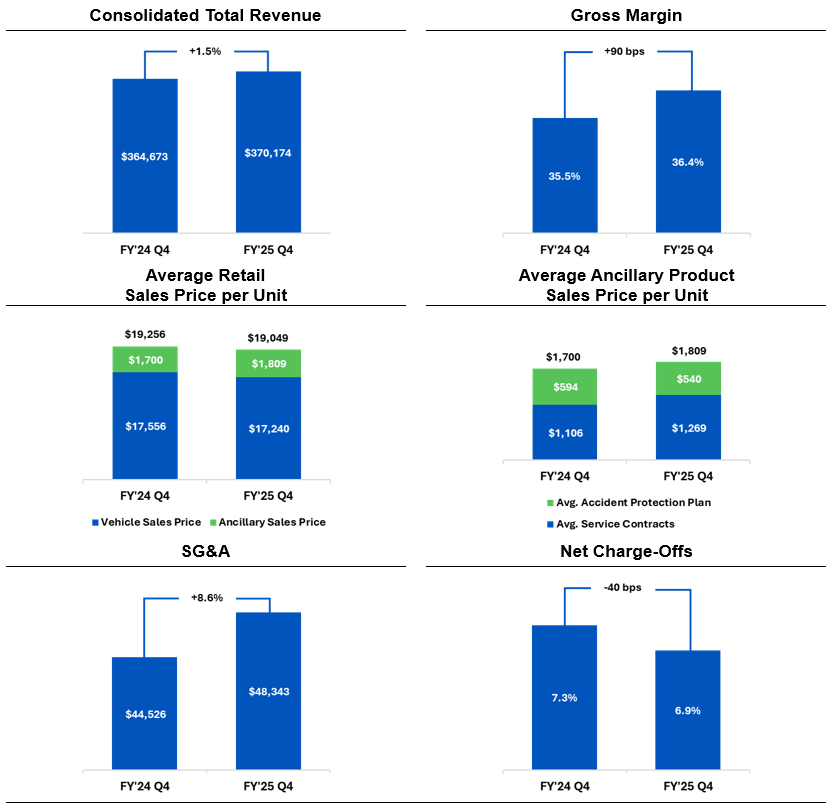
TOTAL REVENUE – A 1.5% increase in revenue to $370.2 million was driven by an increase in retail units sold, and a 4.2% increase in interest income. Sales volumes increased by 2.6%, to 15,649 units vs. 15,251 units. The average vehicle sales price decreased $316 year-over-year and $70 sequentially to $17,240, reflecting the Company’s continued efforts to increase affordability.
GROSS PROFIT – Gross profit margin as a percentage of sales reached 36.4% vs. 35.5%, reflecting a 90-basis point improvement year-over-year. This increase was primarily driven by continued optimization in vehicle pricing, procurement, and disposal strategies.
NET CHARGE-OFFS – Net charge-offs as a percentage of average finance receivables improved to 6.9%, compared to 7.3%. On a relative basis, we saw improvements in both the frequency and severity of losses. Delinquencies (30+ days) increased by 30 basis points to 3.4% of average finance receivables but improved by 30 basis points sequentially.
ALLOWANCE FOR CREDIT LOSSES – The allowance for credit losses as a percentage of finance receivables, net of deferred revenue and pending accident protection plan claims, improved to 23.25% at April 30, 2025, from 24.31% at January 31, 2025. The primary drivers of this change were continued favorable performance in contracts originated under the Company’s enhanced underwriting standards as well as an increase in the outstanding portfolio balance (excluding acquisitions) originated under the Company’s LOS to approximately 65.7%.
UNDERWRITING – As a result of offering more attractive deal terms to appeal to higher-rated customers, the Company experienced a modest shift in financing metrics. For the quarter ending April 30, 2025, the average down payment was 6.2% of the average retail sales price, a slight decrease from 6.5% in the same quarter of 2024. The average loan term was 44.4 months, representing an increase of 0.4 months compared to the prior year’s quarter, but a decrease of 0.2 months from the previous quarter.
SG&A EXPENSE – SG&A expenses were $48.3 million compared to $44.5 million, up 8.6%, primarily due to recent investments in technology and talent. Due to the Company’s most recent acquisitions still building out their base of accounts, SG&A per average customer was $462, compared to $435, a 6.1% increase.
LEVERAGE & LIQUIDITY – Debt to finance receivables and debt, net of cash, to finance receivables (non-GAAP)1 were 51.5% and 43.2%, compared to 52.6% and 46.0%, respectively, at April 30, 2024. During the fiscal year ended April 30, 2025, the Company grew finance receivables by $73.8 million, increased inventory by $4.8 million, and invested in acquisition and fixed assets of $11.4 million, with a $7.8 million decrease in debt, net of cash.
FINANCINGS – On May 29, 2025, Car-Mart completed a term securitization transaction involving the issuance of $216 million of asset-backed notes with an overall weighted average life adjusted coupon of 6.27%. The weighted average life adjusted coupon improved by 22 basis points compared to the Company’s January 2025 issuance and by 117 basis points from the October 2024 securitization transaction. Net proceeds were used to pay down the outstanding balance on the Company’s revolving line of credit. The Company continues to explore options to diversify and expand its financing sources such as potential warehouse lines of credit and the issuance of longer-term debt securities.
(1) Calculation of this non-GAAP financial measure and a reconciliation to the most directly comparable GAAP measure are included in the tables accompanying this release.
| Key Operating Results |
| Three Months Ended | |||||||||||
| April 30, | |||||||||||
| 2025 | 2024 | % Change | |||||||||
| Operating Data: | |||||||||||
| Retail units sold | 15,649 | 15,251 | 2.6 | % | |||||||
| Average number of stores in operation | 154 | 154 | - | ||||||||
| Average retail units sold per store per month | 33.9 | 33.0 | 2.7 | ||||||||
| Average retail sales price | $ | 19,049 | $ | 19,256 | (1.1 | ) | |||||
| Total gross profit per retail unit sold | $ | 7,209 | $ | 7,132 | 1.1 | ||||||
| Total gross profit percentage | 36.4 | % | 35.5 | % | |||||||
| Same store revenue growth | (3.9 | )% | (5.3 | )% | |||||||
| Net charge-offs as a percent of average finance receivables | 6.9 | % | 7.3 | % | |||||||
| Total collected (principal, interest and late fees), in thousands | $ | 191,114 | $ | 187,214 | 2.1 | ||||||
| Average total collected per active customer per month | $ | 612 | $ | 607 | 0.8 | ||||||
| Average percentage of finance receivables-current (excl. 1-2 day) | 80.2 | % | 80.1 | % | |||||||
| Average down-payment percentage | 6.2 | % | 6.5 | % | |||||||
| Years Ended | |||||||||||
| April 30, | |||||||||||
| 2025 | 2024 | % Change | |||||||||
| Operating Data: | |||||||||||
| Retail units sold | 57,022 | 57,989 | (1.7 | ) | % | ||||||
| Average number of stores in operation | 154 | 154 | - | ||||||||
| Average retail units sold per store per month | 30.9 | 31.4 | (1.6 | ) | |||||||
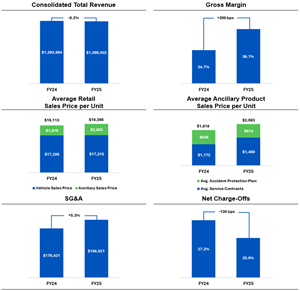
| Average retail sales price | $ | 19,398 | $ | 19,113 | 1.5 | ||||||
| Total gross profit per retail unit sold | $ | 7,368 | $ | 6,937 | 6.2 | ||||||
| Total gross profit percentage | 36.7 | % | 34.7 | % | |||||||
| Same store revenue growth | (5.0 | )% | (1.0 | )% | |||||||
| Net charge-offs as a percent of average finance receivables | 25.9 | % | 27.2 | % | |||||||
| Total collected (principal, interest and late fees), in thousands | $ | 714,102 | $ | 688,907 | 3.7 | ||||||
| Average total collected per active customer per month | $ | 575 | $ | 554 | 3.9 | ||||||
| Average percentage of finance receivables-current (excl. 1-2 day) | 81.4 | % | 80.3 | % | |||||||
| Average down-payment percentage | 5.5 | % | 5.4 | % | |||||||
| Period End Data: | |||||||||||
| Stores open | 154 | 154 | - | % | |||||||
| Accounts over 30 days past due | 3.4 | % | 3.1 | % | |||||||
| Active customer count | 104,682 | 102,252 | 2.4 | ||||||||
| Principal balance of finance receivables (in thousands) | $ | 1,509,154 | $ | 1,435,388 | 5.1 | ||||||
| Weighted average total contract term | 48.3 | 47.9 | 0.9 | ||||||||
| Conference Call and Webcast |
The Company will hold a conference call to discuss its quarterly results on June 12, at 9:00 a.m. ET. Participants may access the conference call via webcast using this link: Webcast Link. To participate via telephone, please register in advance using this Registration Link. Upon registration, all telephone participants will receive a one-time confirmation email detailing how to join the conference call, including the dial-in number along with a unique PIN that can be used to access the call. All participants are encouraged to dial in 10 minutes prior to the start time. A replay and transcript of the conference call and webcast and related supplemental information will be available on-demand via the Company’s investor relations webpage at ir.car-mart.com for 12 months.
| About America’s Car-Mart, Inc. |
America’s Car-Mart, Inc. (the “Company”) operates automotive dealerships in 12 states and is one of the largest publicly held automotive retailers in the United States focused exclusively on the “Integrated Auto Sales and Finance” segment of the used car market. The Company emphasizes superior customer service and the building of strong personal relationships with its customers. The Company operates its dealerships primarily in smaller cities throughout the South-Central United States, selling quality used vehicles and providing financing for substantially all of its customers. For more information about America’s Car-Mart, including investor presentations, please visit our website at www.car-mart.com.
| Non-GAAP Financial Measures |
This news release contains financial information determined by methods other than in accordance with generally accepted accounting principles (GAAP). We present total debt, net of total cash, to finance receivables, a non-GAAP measure, as a supplemental measure of our performance. We believe total debt, net of total cash, to finance receivables is a useful measure to monitor leverage and evaluate balance sheet risk. This measure should not be considered in isolation or as a substitute for reported GAAP results because it may include or exclude certain items as compared to similar GAAP-based measures, and such measures may not be comparable to similarly-titled measures reported by other companies. We strongly encourage investors to review our consolidated financial statements included in publicly filed reports in their entirety and not rely solely on any one, single financial measure or communication. The most directly comparable GAAP financial measure, as well as a reconciliation to the comparable GAAP financial measure, for non-GAAP financial measures are presented in the tables of this release.
| Forward-Looking Statements |
This news release contains “forward-looking statements” within the meaning of the Private Securities Litigation Reform Act of 1995. These forward-looking statements address the Company’s future objectives, plans and goals, as well as the Company’s intent, beliefs and current expectations and projections regarding future financial and operating performance and can generally be identified by words such as “may,” “will,” “should,” “could,” “expect,” “anticipate,” “intend,” “plan,” “project,” “foresee,” and other similar words or phrases. Specific events addressed by these forward-looking statements may include, but are not limited to:
- operational infrastructure investments;
- same dealership sales and revenue growth;
- customer growth and engagement;
- gross profit percentages;
- gross profit per retail unit sold;
- business acquisitions;
- inventory acquisition, reconditioning, transportation, and remarketing;
- technological investments and initiatives;
- future revenue growth;
- receivables growth as related to revenue growth;
- new dealership openings;
- performance of new dealerships;
- interest rates;
- future credit losses;
- the Company’s collection results, including but not limited to collections during income tax refund periods;
- cash-on-cash returns from the collection of contracts originated by the Company;
- seasonality; and
- the Company’s business, operating and growth strategies and expectations.
These forward-looking statements are based on the Company’s current estimates and assumptions and involve various risks and uncertainties. As a result, you are cautioned that these forward-looking statements are not guarantees of future performance, and that actual results could differ materially from those projected in these forward-looking statements. Factors that may cause actual results to differ materially from the Company’s projections include, but are not limited to:
- general economic conditions in the markets in which the Company operates, including but not limited to fluctuations in gas prices, grocery prices and employment levels and inflationary pressure on operating costs;
- the availability of quality used vehicles at prices that will be affordable to our customers, including the impacts of changes in new vehicle production and sales;
- the ability to leverage the Cox Automotive services agreement to perform reconditioning and improve vehicle quality to reduce the average vehicle cost, improve gross margins, reduce credit loss, and enhance cash flow;
- the availability of credit facilities and access to capital through securitization financings or other sources on terms acceptable to us, and any increase in the cost of capital, to support the Company’s business;
- the Company’s ability to underwrite and collect its contracts effectively, including whether anticipated benefits from the Company’s recently implemented loan origination system are achieved as expected or at all;
- competition;
- dependence on existing management;
- ability to attract, develop, and retain qualified general managers;
- changes in consumer finance laws or regulations, including but not limited to rules and regulations that have recently been enacted or could be enacted by federal and state governments;
- the ability to keep pace with technological advances and changes in consumer behavior affecting our business;
- security breaches, cyber-attacks, or fraudulent activity;
- the ability to identify and obtain favorable locations for new or relocated dealerships at reasonable cost;
- the ability to successfully identify, complete and integrate new acquisitions;
- the occurrence and impact of any adverse weather events or other natural disasters affecting the Company’s dealerships or customers; and
- potential business and economic disruptions and uncertainty that may result from any future public health crises and any efforts to mitigate the financial impact and health risks associated with such developments.
Additionally, risks and uncertainties that may affect future results include those described from time to time in the Company’s SEC filings. The Company undertakes no obligation to update or revise any forward-looking statements, whether as a result of new information, future events or otherwise. Readers are cautioned not to place undue reliance on these forward-looking statements, which speak only as of the dates on which they are made.
| Contact for information |
SM Berger & Company
Andrew Berger, Managing Director
andrew@smberger.com
(216) 464-6400
|
America’s Car-Mart Consolidated Results of Operations |
|||||||||||||||||||||
| (Amounts in thousands, except per share data) | |||||||||||||||||||||
| As a % of Sales | |||||||||||||||||||||
| Three Months Ended | Three Months Ended | ||||||||||||||||||||
| April 30, | April 30, | ||||||||||||||||||||
| 2025 | 2024 | % Change |
2025 | 2024 | |||||||||||||||||
| Statements of Operations: | |||||||||||||||||||||
| Revenues: | |||||||||||||||||||||
| Sales | $ | 309,702 | $ | 306,628 | 1.0 | % | 100.0 | % | 100.0 | % | |||||||||||
| Interest income | 60,472 | 58,045 | 4.2 | 19.5 | 18.9 | ||||||||||||||||
| Total | 370,174 | 364,673 | 1.5 | 119.5 | 118.9 | ||||||||||||||||
| . | |||||||||||||||||||||
| Costs and expenses: | |||||||||||||||||||||
| Cost of sales | 196,896 | 197,854 | (0.5 | ) | 63.6 | 64.5 | |||||||||||||||
| Selling, general and administrative | 48,343 | 44,526 | 8.6 | 15.6 | 14.5 | ||||||||||||||||
| Provision for credit losses | 92,962 | 102,106 | (9.0 | ) | 30.0 | 33.3 | |||||||||||||||
| Interest expense | 17,373 | 17,761 | (2.2 | ) | 5.6 | 5.8 | |||||||||||||||
| Depreciation and amortization | 1,947 | 1,770 | 10.0 | 0.6 | 0.6 | ||||||||||||||||
| Loss on disposal of property and equipment | 175 | 78 | 124.4 | - | - | ||||||||||||||||
| Total | 357,696 | 364,095 | (1.8 | ) | 115.4 | 118.7 | |||||||||||||||
| Income before taxes | 12,478 | 578 | 4.1 | 0.2 | |||||||||||||||||
| Provision for income taxes | 1,843 | 152 | 0.7 | 0.0 | |||||||||||||||||
| Net income | $ | 10,635 | $ | 426 | 3.4 | 0.1 | |||||||||||||||
| Dividends on subsidiary preferred stock | $ | (10 | ) | $ | (10 | ) | |||||||||||||||
| Net income attributable to common shareholders | $ | 10,625 | $ | 416 | |||||||||||||||||
| Earnings per share: | |||||||||||||||||||||
| Basic | $ | 1.29 | $ | 0.07 | |||||||||||||||||
| Diluted | $ | 1.26 | $ | 0.06 | |||||||||||||||||
| Weighted average number of shares used in calculation: | |||||||||||||||||||||
| Basic | 8,260,468 | 6,393,258 | |||||||||||||||||||
| Diluted | 8,428,197 | 6,533,758 | |||||||||||||||||||
|
America’s Car-Mart Consolidated Results of Operations |
|||||||||||||||||||||
| (Amounts in thousands, except per share data) | |||||||||||||||||||||
| As a % of Sales | |||||||||||||||||||||
| Twelve Months Ended | Twelve Months Ended | ||||||||||||||||||||
| April 30, | April 30, | ||||||||||||||||||||
| 2025 | 2024 | % Change |
2025 | 2024 | |||||||||||||||||
| Statements of Operations: | |||||||||||||||||||||
| Revenues: | |||||||||||||||||||||
| Sales | $ | 1,146,208 | $ | 1,160,798 | (1.3 | ) | % | 100.0 | % | 100.0 | % | ||||||||||
| Interest income | 244,724 | 233,096 | 5.0 | 21.4 | 20.1 | ||||||||||||||||
| Total | 1,390,932 | 1,393,894 | (0.2 | ) | 121.4 | 120.1 | |||||||||||||||
| Costs and expenses: | |||||||||||||||||||||
| Cost of sales | 726,055 | 758,546 | (4.3 | ) | 63.3 | 65.3 | |||||||||||||||
| Selling, general and administrative | 188,921 | 179,421 | 5.3 | 16.5 | 15.5 | ||||||||||||||||
| Provision for credit losses | 374,559 | 423,406 | (11.5 | ) | 32.7 | 36.5 | |||||||||||||||
| Interest expense | 70,650 | 65,348 | 8.1 | 6.2 | 5.6 | ||||||||||||||||
| Depreciation and amortization | 7,647 | 6,871 | 11.3 | 0.7 | 0.6 | ||||||||||||||||
| Loss on disposal of property and equipment | 299 | 437 | (31.6 | ) | - | - | |||||||||||||||
| Total | 1,368,131 | 1,434,029 | (4.6 | ) | 119.4 | 123.5 | |||||||||||||||
| Income (loss) before taxes | 22,801 | (40,135 | ) | 2.0 | (3.4 | ) | |||||||||||||||
| Provision (benefit) for income taxes | 4,869 | (8,742 | ) | 0.5 | (0.8 | ) | |||||||||||||||
| Net income (loss) | $ | 17,932 | $ | (31,393 | ) | 1.5 | (2.7 | ) | |||||||||||||
| Dividends on subsidiary preferred stock | $ | (40 | ) | $ | (40 | ) | |||||||||||||||
| Net income (loss) attributable to common shareholders | $ | 17,892 | $ | (31,433 | ) | ||||||||||||||||
| Earnings per share: | |||||||||||||||||||||
| Basic | $ | 2.38 | $ | (4.92 | ) | ||||||||||||||||
| Diluted | $ | 2.33 | $ | (4.92 | ) | ||||||||||||||||
| Weighted average number of shares used in calculation: | |||||||||||||||||||||
| Basic | 7,524,770 | 6,388,537 | |||||||||||||||||||
| Diluted | 7,681,590 | 6,388,537 | |||||||||||||||||||
|
America’s Car-Mart Condensed Consolidated Balance Sheet and Other Data | |||||||
| (Amounts in thousands, except per share data) | |||||||
| April 30, | April 30, | ||||||
| 2025 | 2024 | ||||||
| Cash and cash equivalents | $ | 9,808 | $ | 5,522 | |||
| Restricted cash from collections on auto finance receivables | $ | 114,729 | $ | 88,925 | |||
| Finance receivables, net | $ | 1,180,673 | $ | 1,098,591 | |||
| Inventory | $ | 112,229 | $ | 107,470 | |||
| Total assets | $ | 1,606,474 | $ | 1,477,644 | |||
| Revolving lines of credit, net | $ | 204,769 | $ | 200,819 | |||
| Notes payable, net | $ | 572,010 | $ | 553,629 | |||
| Treasury stock | $ | 298,220 | $ | 297,786 | |||
| Total equity | $ | 569,522 | $ | 470,750 | |||
| Shares outstanding | 8,263,280 | 6,394,675 | |||||
| Book value per outstanding share | $ | 68.97 | $ | 73.68 | |||
| Allowance as % of principal balance net of deferred revenue | 23.25 | % | 25.32 | % | |||
| Changes in allowance for credit losses: | |||||||
| Years ended | |||||||
| April 30, | |||||||
| 2025 | 2024 | ||||||
| Balance at beginning of period | $ | 331,260 | $ | 299,608 | |||
| Provision for credit losses | 374,559 | 423,406 | |||||
| Charge-offs, net of collateral recovered | (382,719 | ) | (391,754 | ) | |||
| Balance at end of period | $ | 323,100 | $ | 331,260 | |||
|
America’s Car-Mart Condensed Consolidated Statements of Cash Flows | |||||||||
| (Amounts in thousands) | |||||||||
| Years Ended | |||||||||
| April 30, | |||||||||
| 2025 | 2024 | ||||||||
| Operating activities: | |||||||||
| Net income (loss) | $ | 17,932 | $ | (31,393 | ) | ||||
| Provision for credit losses | 374,559 | 423,406 | |||||||
| Losses on claims for accident protection plan | 34,525 | 34,504 | |||||||
| Depreciation and amortization | 7,647 | 6,871 | |||||||
| Finance receivable originations | (1,075,080 | ) | (1,079,946 | ) | |||||
| Finance receivable collections | 469,379 | 455,828 | |||||||
| Inventory | 114,573 | 139,186 | |||||||
| Deferred accident protection plan revenue | (378 | ) | (1,229 | ) | |||||
| Deferred service contract revenue | (7,158 | ) | 1,540 | ||||||
| Income taxes, net | (6,253 | ) | (15,206 | ) | |||||
| Other | 21,490 | (7,459 | ) | ||||||
| Net cash used in operating activities | (48,764 | ) | (73,898 | ) | |||||
| Investing activities: | |||||||||
| Purchase of investments | (7,527 | ) | (4,815 | ) | |||||
| Purchase of property and equipment and other | (3,848 | ) | (5,830 | ) | |||||
| Net cash used in investing activities | (11,375 | ) | (10,645 | ) | |||||
| Financing activities: | |||||||||
| Change in revolving credit facility, net | 6,579 | 33,227 | |||||||
| Payments on notes payable | (631,331 | ) | (526,959 | ) | |||||
| Change in cash overdrafts | 466 | 823 | |||||||
| Issuances of notes payable | 649,889 | 610,340 | |||||||
| Debt issuance costs | (9,006 | ) | (5,897 | ) | |||||
| Purchase of common stock | (434 | ) | (365 | ) | |||||
| Dividend payments | (40 | ) | (40 | ) | |||||
| Exercise of stock options and issuance of common stock | 74,106 | (173 | ) | ||||||
| Net cash provided by financing activities | 90,229 | 110,956 | |||||||
| Increase in cash, cash equivalents, and restricted cash | $ | 30,090 | $ | 26,413 | |||||
|
America’s Car-Mart Reconciliation of Non-GAAP Financial Measures | |||||||||
| (Amounts in thousands) | |||||||||
| Calculation of Debt, Net of Total Cash, to Finance Receivables: | |||||||||
| April 30, 2025 | April 30, 2024 | ||||||||
| Debt: | |||||||||
| Revolving lines of credit, net | $ | 204,769 | $ | 200,819 | |||||
| Notes payable, net | 572,010 | 553,629 | |||||||
| Total debt | $ | 776,779 | $ | 754,448 | |||||
| Cash: | |||||||||
| Cash and cash equivalents | $ | 9,808 | $ | 5,522 | |||||
| Restricted cash from collections on auto finance receivables | 114,729 | 88,925 | |||||||
| Total cash, cash equivalents, and restricted cash | $ | 124,537 | $ | 94,447 | |||||
| Debt, net of total cash | $ | 652,242 | $ | 660,001 | |||||
| Principal balance of finance receivables | $ | 1,509,154 | $ | 1,435,388 | |||||
| Ratio of debt to finance receivables | 51.5 | % | 52.6 | % | |||||
| Ratio of debt, net of total cash, to finance receivables | 43.2 | % | 46.0 | % | |||||
Charts accompanying this announcement are available at:
https://www.globenewswire.com/NewsRoom/AttachmentNg/b5c9c774-9f8f-407c-a5b7-cd193d7a3f84
https://www.globenewswire.com/NewsRoom/AttachmentNg/13bfedbe-f6bd-43d2-b74a-edf9ab5f8fdc

![]()
Fourth Quarter Fiscal Year 2025 Key Operating Metrics

Dollars in thousands, except per share data. Dollar and percentage changes may not recalculate due to rounding. Charts may not be to scale.
Fiscal Year 2025 Key Operating Metrics
Dollars in thousands, except per share data. Dollar and percentage changes may not recalculate due to rounding. Charts may not be to scale.
Distribution channels: Business & Economy, Retail ...
Legal Disclaimer:
EIN Presswire provides this news content "as is" without warranty of any kind. We do not accept any responsibility or liability for the accuracy, content, images, videos, licenses, completeness, legality, or reliability of the information contained in this article. If you have any complaints or copyright issues related to this article, kindly contact the author above.
Submit your press release